Registered Nurse Salary in Oregon: $135,161 (2026)
Quick Answer:Across Oregon's 36 metropolitan areas, the average median registered nurse pay sits at $135,161/year heading into 2026 — a figure projected from 2025 BLS OEWS wage data for SOC 29-1141. Because Oregon sits at BEA RPP 102.6 (3% above the U.S. baseline), that statewide median translates to roughly $131,736 in nationally-comparable purchasing power. Highest-paying metros: Bend ($135,010), Hillsboro ($133,276), Salem ($131,750).
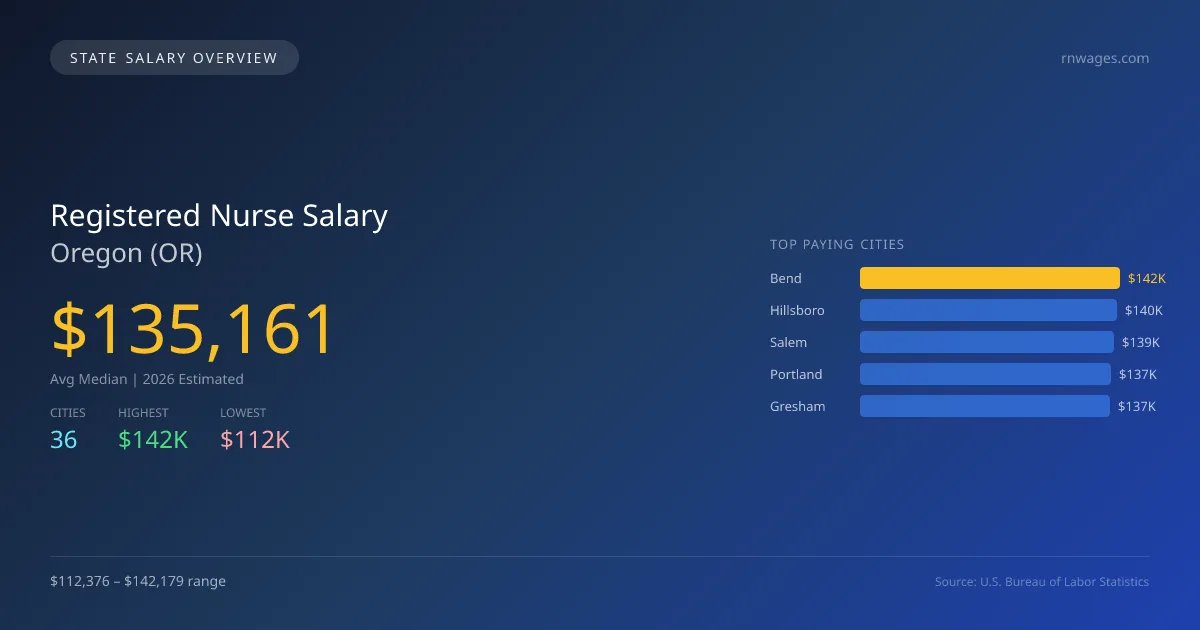
In 2026, registered nurses in Oregon are projected to earn an average median salary of $135,161, which is 31.6% higher than the national median of $102,730. This significant salary difference reflects Oregon's high demand for healthcare professionals, as well as the state’s specific licensing requirements and scope of practice laws that allow RNs to perform a wide range of clinical duties. The cities of Bend, Hillsboro, Salem, Portland, and Gresham rank as the top five highest-paying locations within the state, with Bend leading at $142,179 and Grants Pass at the lower end with $112,376. The salary gap of $29,803 between these cities is driven by factors such as cost of living variations, local healthcare facility funding, and demand for specialized nursing services. The overall job market for registered nurses in Oregon is strong, with a projected annual growth rate of 5.31%, indicating ongoing demand for nursing professionals across various settings. As healthcare continues to evolve, factors such as population growth, aging demographics, and the expansion of healthcare coverage are likely to sustain this demand, making Oregon a viable state for nursing career advancement.
Oregon Registered Nurse Salary Range
Overall salary range in Oregon: $86,257 (lowest entry-level) to $197,405 (highest top earner)
Oregon vs National Average
Oregon registered nurses earn 31.57% more than the national median (+$32,431/year difference).
Oregon Registered Nurse Salary Distribution (2026)
Registered Nurse salaries in Oregon range from $102,224 (entry-level, 10th percentile) to $161,841 (top earners, 90th percentile), with a median of $135,161. The Oregon median is $32,431 above the US national median of $102,730. The average hourly rate is $64.98/hr. Approximately 38,026 registered nurses are employed across 36 cities.
2019 BLS Actual
$94,166
2025 BLS Actual
$128,346
2026 Current Est.
$135,161
2019–2027 Growth
+51.2%
Salary Trajectory for Registered Nurses in Oregon (2019–2027)
2019–2025: actual BLS OEWS data for this metro area. 2026+: CAGR 5.31% projection.
| Year | Annual Salary | Status |
|---|---|---|
| 2019 | $94,166 | Actual |
| 2020 | $97,570 | Actual |
| 2021 | $100,200 | Actual |
| 2022 | $106,107 | Actual |
| 2023 | $113,122 | Actual |
| 2024 | $124,268 | Actual |
| 2025 | $128,346 | Actual |
| 2026(current) | $135,161 | Estimated |
| 2027 | $142,338 | Projected |
Based on 7 years of BLS OEWS data for the Oregon metropolitan area, the median registered nurse salary grew 36.3% from $94,166 (2019) to $128,346 (2025). At a 5.31% compound annual growth rate, salaries are projected to reach $142,338 by 2027 — a total increase of $48,172 (51.16%) from 2019.
Note: Historical values (2019–2025) are actual BLS OEWS figures for the Oregon metropolitan area, sourced from annual Occupational Employment and Wage Statistics surveys. 2026–2026 figures are current estimates, and 2027 values are projections, calculated using a 5.31% CAGR derived from 7-year BLS historical data. Actual salaries may vary based on employer, experience, certifications, and local market conditions.
Top 5 Highest Paying Cities in Oregon
Lowest Paying Cities in Oregon
| City | Median Salary |
|---|---|
| Grants Pass | $112,376 |
| Albany | $117,863 |
| Springfield | $118,212 |
| Eugene | $119,759 |
| Milwaukie | $122,947 |
Best Value Cities for Registered Nurses in Oregon
When adjusted for local cost of living, these Oregon cities offer the most purchasing power for registered nurses.
| City | Nominal Salary | CoL Index | Adjusted Salary |
|---|---|---|---|
| Bend | $142,179 | 103.607 | $137,229 |
| Hillsboro | $140,353 | 102.6 | $136,796 |
| Salem | $138,746 | 103.649 | $133,861 |
| Gresham | $136,880 | 102.6 | $133,411 |
| Medford | $133,775 | 101.433 | $131,885 |
Adjusted salary = nominal salary × (100 / CoL index). CoL index: 100 = national average. Lower index = lower cost of living.
Salary by Experience Level in Oregon
| Experience Level | Estimated Annual |
|---|---|
| Entry Level (0-2 years) | $102,224 |
| Mid Career (3-7 years) | $135,161 |
| Experienced (7+ years) | $161,841 |
Estimates based on BLS percentile data averaged across Oregon metro areas. Individual pay varies by employer, certifications, and specialization.
All 36 Cities in Oregon
| # | City | Median Salary |
|---|---|---|
| 1 | Bend | $142,179 |
| 2 | Hillsboro | $140,353 |
| 3 | Salem | $138,746 |
| 4 | Portland | $137,229 |
| 5 | Gresham | $136,880 |
| 6 | Medford | $133,775 |
| 7 | Corvallis | $133,004 |
| 8 | Beaverton | $132,983 |
| 9 | McMinnville | $132,622 |
| 10 | Oregon City | $132,466 |
| 11 | Woodburn | $131,584 |
| 12 | Lake Oswego | $130,951 |
| 13 | Forest Grove | $130,608 |
| 14 | Tigard | $130,059 |
| 15 | Redmond | $130,017 |
| 16 | West Linn | $129,643 |
| 17 | Tualatin | $128,521 |
| 18 | Pendleton | $128,510 |
| 19 | Wilsonville | $128,324 |
| 20 | Happy Valley | $127,223 |
| 21 | Hermiston | $126,870 |
| 22 | Central Point | $126,810 |
| 23 | Ashland | $126,800 |
| 24 | Keizer | $126,767 |
| 25 | Sherwood | $126,760 |
| 26 | Coos Bay | $126,549 |
| 27 | Roseburg | $126,086 |
| 28 | Canby | $126,015 |
| 29 | Newberg | $125,321 |
| 30 | The Dalles | $123,984 |
| 31 | Klamath Falls | $123,239 |
| 32 | Milwaukie | $122,947 |
| 33 | Eugene | $119,759 |
| 34 | Springfield | $118,212 |
| 35 | Albany | $117,863 |
| 36 | Grants Pass | $112,376 |
More Oregon Salary Data
Explore More Registered Nurse Salary Data
Frequently Asked Questions
How much do registered nurses make in Oregon in 2026?
What is the highest paying city for registered nurses in Oregon?
How does Oregon registered nurse pay compare to the national average?
What is the entry-level registered nurse salary in Oregon?
How many registered nurses are employed in Oregon?
Which Oregon city offers the best value for registered nurses?
Written by Jordan Lee, RN, BSN
Career Analyst
Jordan Lee has 10 years of experience as a registered nurse. Their specialty is pediatric nursing in a community hospital. They analyze nursing workforce trends and salary data.
Methodology & Data Source
Statewide salary figures on this page are 2026 projections based on the Bureau of Labor Statistics Occupational Employment and Wage Statistics (OEWS) survey, May 2026 release. A 5.31% compound annual growth rate (CAGR), derived from 6-year national BLS wage trends, was applied to each metro area's reported salary to estimate current 2026 registered nurse compensation across Oregon. State averages are employment-weighted across 36 metro areas — larger metro areas with more registered nursescontribute proportionally more to the average, producing figures that better reflect typical compensation. Individual pay varies by city, employer, certifications, and experience.
Data Sources & Methodology
Source: BLS, OEWS, 7-year dataset (–). Per-city data from annual BLS metropolitan area surveys.
2026 figures are projected from 2025 BLS data using a compound annual growth rate (CAGR) of 5.31%, derived from historical BLS wage trends for registered nurses (SOC 29-1141).
Compiled and verified by Jordan Lee, RN, BSN, a licensed registered nurse with 10+ years of clinical experience. · View source data at BLS.gov