Registered Nurse Salary in Washington: $129,484 (2026)
Quick Answer:Across Washington's 50 metropolitan areas, the average median registered nurse pay sits at $129,484/year heading into 2026 — a figure projected from 2025 BLS OEWS wage data for SOC 29-1141. Because Washington sits at BEA RPP 107.4 (7% above the U.S. baseline), that statewide median translates to roughly $120,562 in nationally-comparable purchasing power. Highest-paying metros: Vancouver ($131,149), Bellevue ($129,517), Seattle ($128,260).
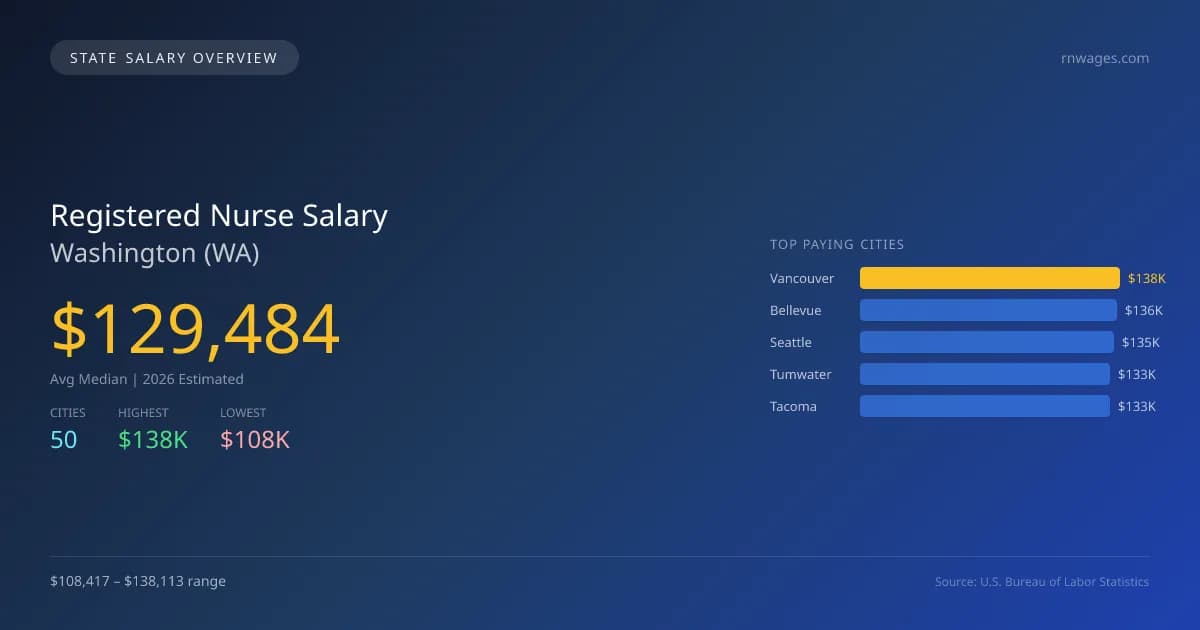
In 2026, registered nurses in Washington are projected to earn an average median salary of $129,484, which is 26.0% higher than the national median of $102,730. This indicates a strong financial incentive for nursing professionals in the state. The salary range across Washington varies significantly, with Vancouver at the top with an average of $138,113, while Yakima sits at the low end with $108,417, creating a salary gap of $29,696. This disparity is influenced by factors such as the cost of living, local demand for healthcare services, and competition among employers. Washington has specific licensing requirements and scope of practice laws that can impact nurse salaries. The state maintains a high demand for registered nurses, driven by an aging population and an expanding healthcare system, contributing to a projected annual growth rate of 5.31%. The employment outlook remains positive, with a total of 58,453 registered nurses currently employed. Cities like Bellevue, Seattle, Tumwater, and Tacoma also present strong earning potential, highlighting the diverse opportunities within the state. As the healthcare landscape evolves, Washington remains an appealing place for registered nurses seeking both salary and career growth.
Washington Registered Nurse Salary Range
Overall salary range in Washington: $77,570 (lowest entry-level) to $204,103 (highest top earner)
Washington vs National Average
Washington registered nurses earn 26.04% more than the national median (+$26,754/year difference).
Washington Registered Nurse Salary Distribution (2026)
Registered Nurse salaries in Washington range from $99,099 (entry-level, 10th percentile) to $167,973 (top earners, 90th percentile), with a median of $129,484. The Washington median is $26,754 above the US national median of $102,730. The average hourly rate is $62.25/hr. Approximately 58,453 registered nurses are employed across 50 cities.
2019 BLS Actual
$85,798
2025 BLS Actual
$122,955
2026 Current Est.
$129,484
2019–2027 Growth
+58.9%
Salary Trajectory for Registered Nurses in Washington (2019–2027)
2019–2025: actual BLS OEWS data for this metro area. 2026+: CAGR 5.31% projection.
| Year | Annual Salary | Status |
|---|---|---|
| 2019 | $85,798 | Actual |
| 2020 | $90,065 | Actual |
| 2021 | $94,445 | Actual |
| 2022 | $99,536 | Actual |
| 2023 | $106,467 | Actual |
| 2024 | $112,724 | Actual |
| 2025 | $122,955 | Actual |
| 2026(current) | $129,484 | Estimated |
| 2027 | $136,360 | Projected |
Based on 7 years of BLS OEWS data for the Washington metropolitan area, the median registered nurse salary grew 43.3% from $85,798 (2019) to $122,955 (2025). At a 5.31% compound annual growth rate, salaries are projected to reach $136,360 by 2027 — a total increase of $50,562 (58.93%) from 2019.
Note: Historical values (2019–2025) are actual BLS OEWS figures for the Washington metropolitan area, sourced from annual Occupational Employment and Wage Statistics surveys. 2026–2026 figures are current estimates, and 2027 values are projections, calculated using a 5.31% CAGR derived from 7-year BLS historical data. Actual salaries may vary based on employer, experience, certifications, and local market conditions.
Top 5 Highest Paying Cities in Washington
Lowest Paying Cities in Washington
| City | Median Salary |
|---|---|
| Yakima | $108,417 |
| Tukwila | $108,778 |
| Mountlake Terrace | $108,946 |
| Covington | $110,477 |
| Kenmore | $110,486 |
Best Value Cities for Registered Nurses in Washington
When adjusted for local cost of living, these Washington cities offer the most purchasing power for registered nurses.
| City | Nominal Salary | CoL Index | Adjusted Salary |
|---|---|---|---|
| Vancouver | $138,113 | 107.4 | $128,597 |
| Olympia | $131,659 | 103.67 | $126,998 |
| Bellevue | $136,394 | 107.4 | $126,996 |
| Walla Walla | $123,181 | 98.519 | $125,033 |
| Tumwater | $132,864 | 107.4 | $123,709 |
Adjusted salary = nominal salary × (100 / CoL index). CoL index: 100 = national average. Lower index = lower cost of living.
Salary by Experience Level in Washington
| Experience Level | Estimated Annual |
|---|---|
| Entry Level (0-2 years) | $99,099 |
| Mid Career (3-7 years) | $129,484 |
| Experienced (7+ years) | $167,973 |
Estimates based on BLS percentile data averaged across Washington metro areas. Individual pay varies by employer, certifications, and specialization.
All 50 Cities in Washington
| # | City | Median Salary |
|---|---|---|
| 1 | Vancouver | $138,113 |
| 2 | Bellevue | $136,394 |
| 3 | Seattle | $135,071 |
| 4 | Tumwater | $132,864 |
| 5 | Tacoma | $132,818 |
| 6 | Olympia | $131,659 |
| 7 | Lacey | $130,579 |
| 8 | Walla Walla | $123,181 |
| 9 | Renton | $120,758 |
| 10 | Spokane Valley | $119,948 |
| 11 | Everett | $119,588 |
| 12 | Marysville | $118,693 |
| 13 | Wenatchee | $118,242 |
| 14 | Shoreline | $118,040 |
| 15 | Spokane | $117,684 |
| 16 | Bellingham | $117,584 |
| 17 | Redmond | $117,574 |
| 18 | Kent | $117,478 |
| 19 | Kirkland | $117,286 |
| 20 | Burien | $117,136 |
| 21 | Federal Way | $116,621 |
| 22 | Des Moines | $116,596 |
| 23 | Auburn | $116,325 |
| 24 | Lakewood | $116,279 |
| 25 | Issaquah | $116,213 |
| 26 | Sammamish | $115,449 |
| 27 | University Place | $115,409 |
| 28 | SeaTac | $115,318 |
| 29 | Pasco | $114,825 |
| 30 | Longview | $114,770 |
| 31 | Richland | $114,396 |
| 32 | Edmonds | $114,121 |
| 33 | Lake Stevens | $113,820 |
| 34 | Lynnwood | $113,747 |
| 35 | Moses Lake | $113,527 |
| 36 | Bothell | $113,445 |
| 37 | Pullman | $112,943 |
| 38 | Bremerton | $112,913 |
| 39 | Puyallup | $112,688 |
| 40 | Mount Vernon | $112,397 |
| 41 | Ellensburg | $112,265 |
| 42 | Kennewick | $112,060 |
| 43 | Maple Valley | $111,957 |
| 44 | Camas | $111,674 |
| 45 | Oak Harbor | $111,202 |
| 46 | Kenmore | $110,486 |
| 47 | Covington | $110,477 |
| 48 | Mountlake Terrace | $108,946 |
| 49 | Tukwila | $108,778 |
| 50 | Yakima | $108,417 |
More Washington Salary Data
Senior / Experienced
Top earner salaries for experienced registered nurses.
Compare Cities in Washington
View all comparisons →Explore More Registered Nurse Salary Data
Frequently Asked Questions
How much do registered nurses make in Washington in 2026?
What is the highest paying city for registered nurses in Washington?
How does Washington registered nurse pay compare to the national average?
What is the entry-level registered nurse salary in Washington?
How many registered nurses are employed in Washington?
Which Washington city offers the best value for registered nurses?
Written by Jordan Lee, RN, BSN
Career Analyst
Jordan Lee has 10 years of experience as a registered nurse. Their specialty is pediatric nursing in a community hospital. They analyze nursing workforce trends and salary data.
Methodology & Data Source
Statewide salary figures on this page are 2026 projections based on the Bureau of Labor Statistics Occupational Employment and Wage Statistics (OEWS) survey, May 2026 release. A 5.31% compound annual growth rate (CAGR), derived from 6-year national BLS wage trends, was applied to each metro area's reported salary to estimate current 2026 registered nurse compensation across Washington. State averages are employment-weighted across 50 metro areas — larger metro areas with more registered nursescontribute proportionally more to the average, producing figures that better reflect typical compensation. Individual pay varies by city, employer, certifications, and experience.
Data Sources & Methodology
Source: BLS, OEWS, 7-year dataset (–). Per-city data from annual BLS metropolitan area surveys.
2026 figures are projected from 2025 BLS data using a compound annual growth rate (CAGR) of 5.31%, derived from historical BLS wage trends for registered nurses (SOC 29-1141).
Compiled and verified by Jordan Lee, RN, BSN, a licensed registered nurse with 10+ years of clinical experience. · View source data at BLS.gov