Registered Nurse Salary in Massachusetts: $110,326 (2026)
Quick Answer:Across Massachusetts's 59 metropolitan areas, the average median registered nurse pay sits at $110,326/year heading into 2026 — a figure projected from 2025 BLS OEWS wage data for SOC 29-1141. Because Massachusetts sits at BEA RPP 108.5 (9% above the U.S. baseline), that statewide median translates to roughly $101,683 in nationally-comparable purchasing power. Highest-paying metros: Boston ($106,180), Newton ($105,326), Lynn ($105,097).
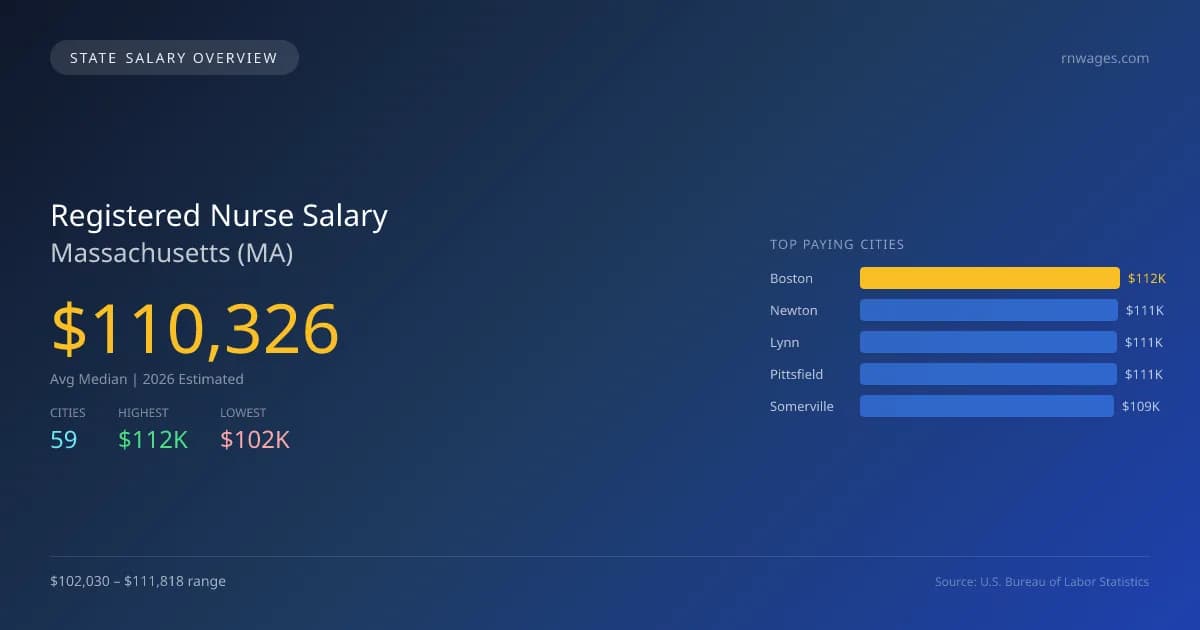
Massachusetts offers a favorable landscape for registered nurses, with an average median salary of $110,326 in 2026, surpassing the national median of $102,730 by 7.4%. The highest salaries are found in Boston at $111,818, while the lowest in Andover stands at $102,030, reflecting a salary gap of $9,788. This difference is driven by factors such as cost of living, with urban areas like Boston and Newton featuring higher demand for healthcare services compared to more suburban locations. The state has specific licensing requirements and scope of practice laws that ensure a qualified workforce, influencing the overall salary levels. Massachusetts ranks well in terms of employment stability for registered nurses, with a total of 84,967 registered nurses. The job market is projected to grow at an annual rate of 5.31%, fueled by an aging population and increased healthcare access needs. Key urban centers like Lynn, Pittsfield, and Somerville are also expected to see salaries in the vicinity of $109,229 to $110,678. Overall, the state's combination of competitive salaries and growth potential positions it favorably for upcoming nursing professionals.
Massachusetts Registered Nurse Salary Range
Overall salary range in Massachusetts: $71,191 (lowest entry-level) to $198,688 (highest top earner)
Massachusetts vs National Average
Massachusetts registered nurses earn 7.39% more than the national median (+$7,596/year difference).
Massachusetts Registered Nurse Salary Distribution (2026)
Registered Nurse salaries in Massachusetts range from $85,034 (entry-level, 10th percentile) to $189,028 (top earners, 90th percentile), with a median of $110,326. The Massachusetts median is $7,596 above the US national median of $102,730. The average hourly rate is $53.04/hr. Approximately 84,967 registered nurses are employed across 59 cities.
2019 BLS Actual
$88,270
2025 BLS Actual
$104,763
2026 Current Est.
$110,326
2019–2027 Growth
+31.6%
Salary Trajectory for Registered Nurses in Massachusetts (2019–2027)
2019–2025: actual BLS OEWS data for this metro area. 2026+: CAGR 5.31% projection.
| Year | Annual Salary | Status |
|---|---|---|
| 2019 | $88,270 | Actual |
| 2020 | $90,825 | Actual |
| 2021 | $92,647 | Actual |
| 2022 | $96,972 | Actual |
| 2023 | $98,668 | Actual |
| 2024 | $101,777 | Actual |
| 2025 | $104,763 | Actual |
| 2026(current) | $110,326 | Estimated |
| 2027 | $116,185 | Projected |
Based on 7 years of BLS OEWS data for the Massachusetts metropolitan area, the median registered nurse salary grew 18.7% from $88,270 (2019) to $104,763 (2025). At a 5.31% compound annual growth rate, salaries are projected to reach $116,185 by 2027 — a total increase of $27,915 (31.62%) from 2019.
Note: Historical values (2019–2025) are actual BLS OEWS figures for the Massachusetts metropolitan area, sourced from annual Occupational Employment and Wage Statistics surveys. 2026–2026 figures are current estimates, and 2027 values are projections, calculated using a 5.31% CAGR derived from 7-year BLS historical data. Actual salaries may vary based on employer, experience, certifications, and local market conditions.
Top 5 Highest Paying Cities in Massachusetts
Lowest Paying Cities in Massachusetts
| City | Median Salary |
|---|---|
| Andover | $102,030 |
| Leominster | $102,280 |
| Wellesley | $102,373 |
| Chelmsford | $102,431 |
| Woburn | $102,523 |
Best Value Cities for Registered Nurses in Massachusetts
When adjusted for local cost of living, these Massachusetts cities offer the most purchasing power for registered nurses.
| City | Nominal Salary | CoL Index | Adjusted Salary |
|---|---|---|---|
| Pittsfield | $110,523 | 95.106 | $116,210 |
| Barnstable Town | $108,869 | 98.351 | $110,694 |
| Springfield | $103,636 | 96.061 | $107,886 |
| Amherst Town | $106,647 | 100.243 | $106,388 |
| Boston | $111,818 | 108.266 | $103,281 |
Adjusted salary = nominal salary × (100 / CoL index). CoL index: 100 = national average. Lower index = lower cost of living.
Salary by Experience Level in Massachusetts
| Experience Level | Estimated Annual |
|---|---|
| Entry Level (0-2 years) | $85,034 |
| Mid Career (3-7 years) | $110,326 |
| Experienced (7+ years) | $189,028 |
Estimates based on BLS percentile data averaged across Massachusetts metro areas. Individual pay varies by employer, certifications, and specialization.
All 59 Cities in Massachusetts
| # | City | Median Salary |
|---|---|---|
| 1 | Boston | $111,818 |
| 2 | Newton | $110,919 |
| 3 | Lynn | $110,678 |
| 4 | Pittsfield | $110,523 |
| 5 | Somerville | $109,229 |
| 6 | Cambridge | $109,147 |
| 7 | Revere | $109,058 |
| 8 | Barnstable Town | $108,869 |
| 9 | Brockton | $108,684 |
| 10 | New Bedford | $108,562 |
| 11 | Plymouth | $108,495 |
| 12 | Malden | $108,102 |
| 13 | Haverhill | $108,085 |
| 14 | Lowell | $108,056 |
| 15 | Framingham | $108,008 |
| 16 | Peabody | $107,863 |
| 17 | Weymouth | $107,538 |
| 18 | Chicopee | $107,214 |
| 19 | Randolph | $107,097 |
| 20 | Quincy | $106,908 |
| 21 | Amherst | $106,779 |
| 22 | Chelsea | $106,771 |
| 23 | Amherst Town | $106,647 |
| 24 | Medford | $106,480 |
| 25 | Fall River | $106,378 |
| 26 | Marlborough | $106,378 |
| 27 | Watertown | $106,361 |
| 28 | Fitchburg | $106,278 |
| 29 | Methuen | $106,237 |
| 30 | Taunton | $106,190 |
| 31 | Arlington | $106,152 |
| 32 | Needham | $105,877 |
| 33 | Westfield | $105,826 |
| 34 | Everett | $105,809 |
| 35 | Worcester | $105,563 |
| 36 | Holyoke | $105,266 |
| 37 | Northampton | $105,235 |
| 38 | Beverly | $105,090 |
| 39 | Lawrence | $105,089 |
| 40 | Dartmouth | $104,965 |
| 41 | Waltham | $104,859 |
| 42 | Barnstable | $104,748 |
| 43 | Brookline | $104,517 |
| 44 | Billerica | $104,354 |
| 45 | Braintree | $104,003 |
| 46 | Salem | $103,827 |
| 47 | Natick | $103,761 |
| 48 | Springfield | $103,636 |
| 49 | Dracut | $103,217 |
| 50 | Lexington | $103,150 |
| 51 | Stoughton | $103,150 |
| 52 | Shrewsbury | $103,016 |
| 53 | Franklin | $102,740 |
| 54 | Attleboro | $102,657 |
| 55 | Woburn | $102,523 |
| 56 | Chelmsford | $102,431 |
| 57 | Wellesley | $102,373 |
| 58 | Leominster | $102,280 |
| 59 | Andover | $102,030 |
More Massachusetts Salary Data
Compare Cities in Massachusetts
View all comparisons →Explore More Registered Nurse Salary Data
Frequently Asked Questions
How much do registered nurses make in Massachusetts in 2026?
What is the highest paying city for registered nurses in Massachusetts?
How does Massachusetts registered nurse pay compare to the national average?
What is the entry-level registered nurse salary in Massachusetts?
How many registered nurses are employed in Massachusetts?
Which Massachusetts city offers the best value for registered nurses?
Written by Jordan Lee, RN, BSN
Career Analyst
Jordan Lee has 10 years of experience as a registered nurse. Their specialty is pediatric nursing in a community hospital. They analyze nursing workforce trends and salary data.
Methodology & Data Source
Statewide salary figures on this page are 2026 projections based on the Bureau of Labor Statistics Occupational Employment and Wage Statistics (OEWS) survey, May 2026 release. A 5.31% compound annual growth rate (CAGR), derived from 6-year national BLS wage trends, was applied to each metro area's reported salary to estimate current 2026 registered nurse compensation across Massachusetts. State averages are employment-weighted across 59 metro areas — larger metro areas with more registered nursescontribute proportionally more to the average, producing figures that better reflect typical compensation. Individual pay varies by city, employer, certifications, and experience.
Data Sources & Methodology
Source: BLS, OEWS, 7-year dataset (–). Per-city data from annual BLS metropolitan area surveys.
2026 figures are projected from 2025 BLS data using a compound annual growth rate (CAGR) of 5.31%, derived from historical BLS wage trends for registered nurses (SOC 29-1141).
Compiled and verified by Jordan Lee, RN, BSN, a licensed registered nurse with 10+ years of clinical experience. · View source data at BLS.gov